River Monitoring
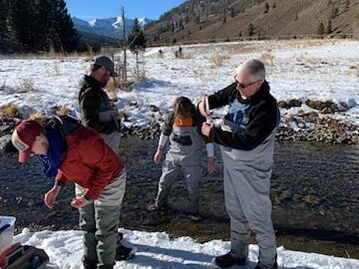
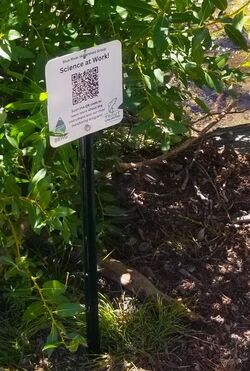
Community members sample the river regularly for the following:
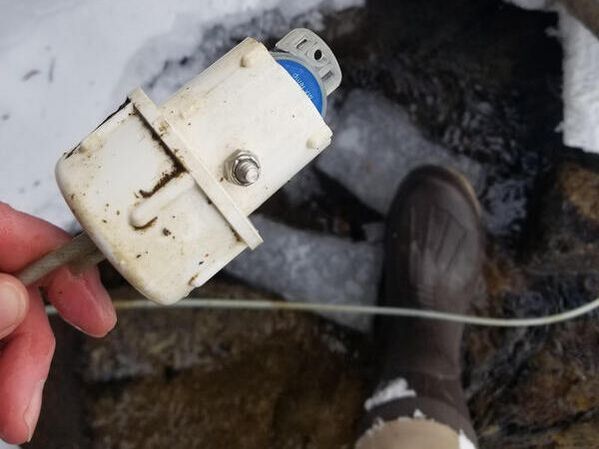
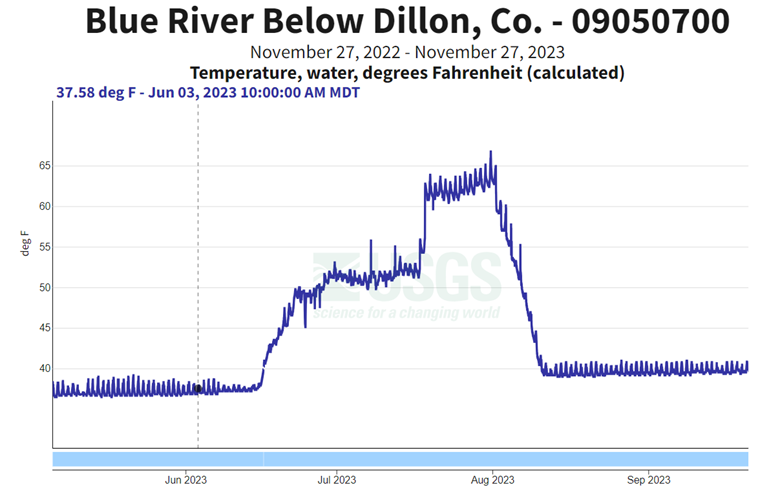
TemperatureTracking the thermograph (temperature as we move downstream) helps tell the story of how the river is impacted by humans
|
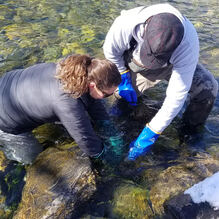
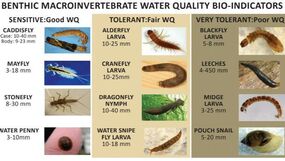
MacroinvertebratesAquatic life indicates water quality over time. Macroinvertebrates give valuable data on the functionality of the food web
|
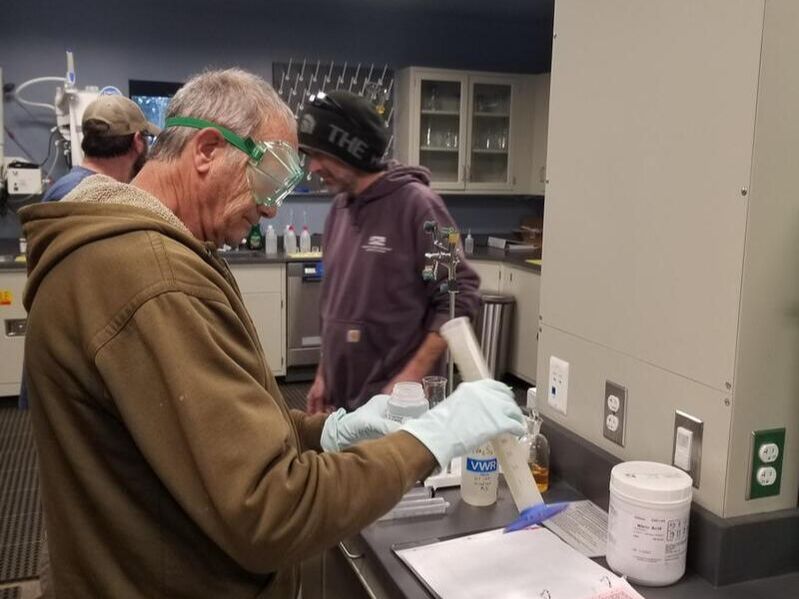
Water QualityConcentration of metals, water hardness, alkalinity, PH, and nutrient loads are monitored monthly as they vary by location and season
|
Working with Colorado Parks and Wildlife's River Watch Program, Blue River Watershed Group staff, volunteers, and student-collected data contributes to a state-wide water quality database. With this information, coordinated management practices are implemented and specific water quality concerns are addressed.
Why we monitor temperature
The Blue River has two major impoundments (dams) that affect the temperature of the water. Dillon Reservoir is primarily a bottom release dam with the outlet structure located over 250 feet below the surface of the lake. Temperatures at that depth are steady and cold. In the summer, water entering the reservoir is much warmer that what is released from the dam. In the winter, the insulated water is actually warmer. When the surface water spills over the top the temperatures increase dramatically. The result, a challenging thermograph for the life cycles of aquatic fish and bugs. By monitoring water flowing out of the dam and comparing it to the natural stream temperatures, we can understand our target "natural" temperatures, see how far downstream our river recovers from the impact, and build a habitat restoration plan to better support our ecosystem.
The Blue River has two major impoundments (dams) that affect the temperature of the water. Dillon Reservoir is primarily a bottom release dam with the outlet structure located over 250 feet below the surface of the lake. Temperatures at that depth are steady and cold. In the summer, water entering the reservoir is much warmer that what is released from the dam. In the winter, the insulated water is actually warmer. When the surface water spills over the top the temperatures increase dramatically. The result, a challenging thermograph for the life cycles of aquatic fish and bugs. By monitoring water flowing out of the dam and comparing it to the natural stream temperatures, we can understand our target "natural" temperatures, see how far downstream our river recovers from the impact, and build a habitat restoration plan to better support our ecosystem.
Why we monitor macroinvertebrates
In the fall, annually, a bug collection takes place at each River Watch site. Macroinvertebrate populations are an indication of long-term water quality and ecosystem functionality. Macroinvertebrates feed on algae and detritus and are the food for fish. Their abundancy and diversity of population give objective scores to the river and track trends over time. Population trends can show disturbance and recovery for large-scale planning and restoration efforts.
In the fall, annually, a bug collection takes place at each River Watch site. Macroinvertebrate populations are an indication of long-term water quality and ecosystem functionality. Macroinvertebrates feed on algae and detritus and are the food for fish. Their abundancy and diversity of population give objective scores to the river and track trends over time. Population trends can show disturbance and recovery for large-scale planning and restoration efforts.
Why we monitor water quality
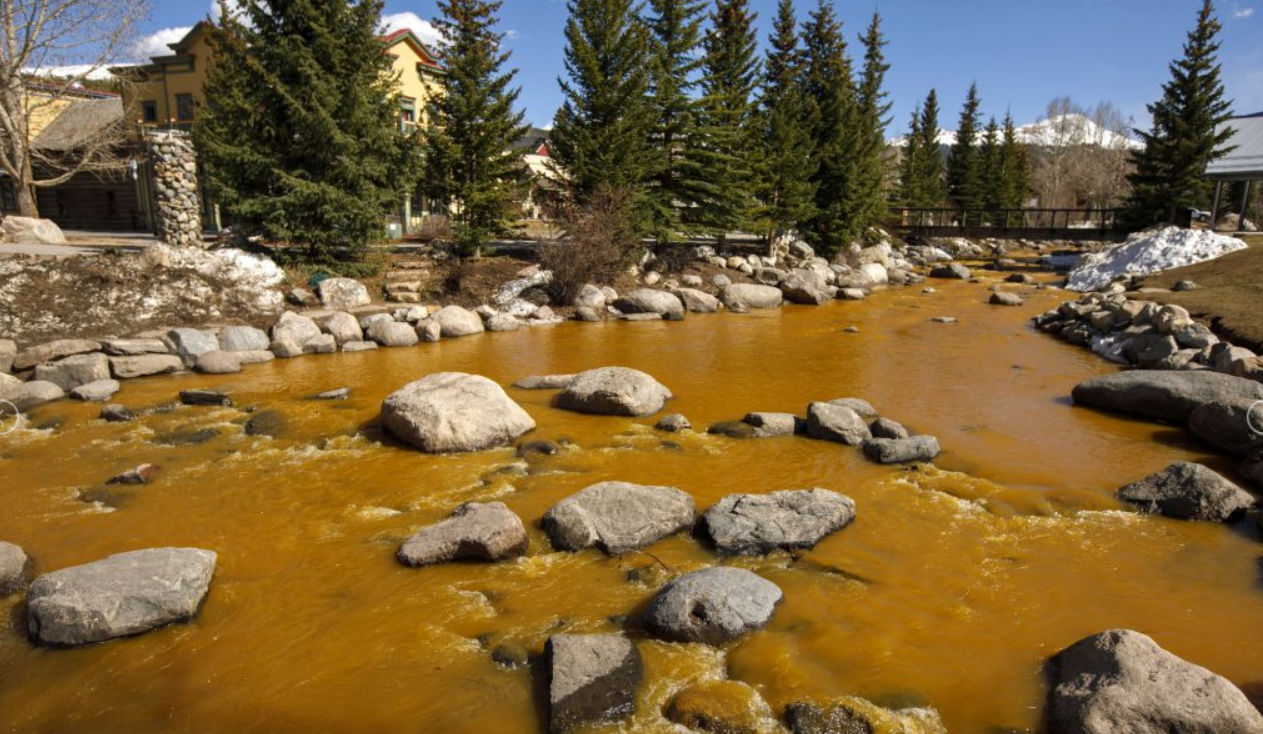
The Blue River watershed has a rich history of historic mining. Some of our tributaries (smaller streams) are highly impacted by acid mine runoff. Monthly monitoring of metal, PH (acidity), and chemical resilience allows us to watch for dangerous spikes in loading, watch trends over seasons and time, and identify areas of concern. Though much work is being done to "clean up" old mines and mine runoff, our community still has a lot of work to do. Water quality monitoring is keeping a pulse on the health of our rivers.
The Blue River watershed has a rich history of historic mining. Some of our tributaries (smaller streams) are highly impacted by acid mine runoff. Monthly monitoring of metal, PH (acidity), and chemical resilience allows us to watch for dangerous spikes in loading, watch trends over seasons and time, and identify areas of concern. Though much work is being done to "clean up" old mines and mine runoff, our community still has a lot of work to do. Water quality monitoring is keeping a pulse on the health of our rivers.
There are 2 main avenues for citizens to participate in water science. #1 Adopt a Logger, #2 River Watch Volunteer
Adopt a LoggerTime Commitment: Flexible timing, self-directed visits. Loggers should be checked monthly in the summer months and at least once in the winter.
|
River WatchTime Commitment: Flexible. Monthly sample and processing events.
|
To learn more, become involved in Citizen Science, or report a water quality concern, please contact Kendra Tully at [email protected]
Temperature Logger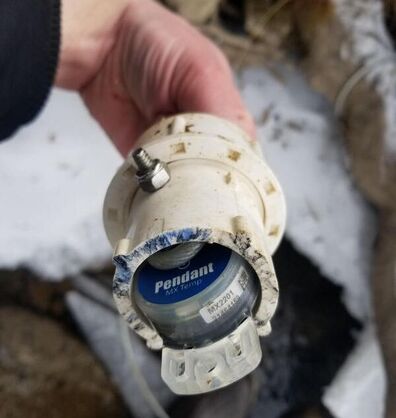
|
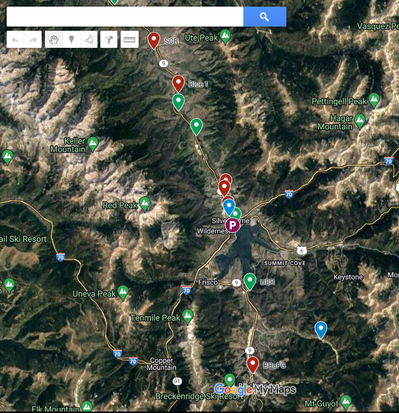
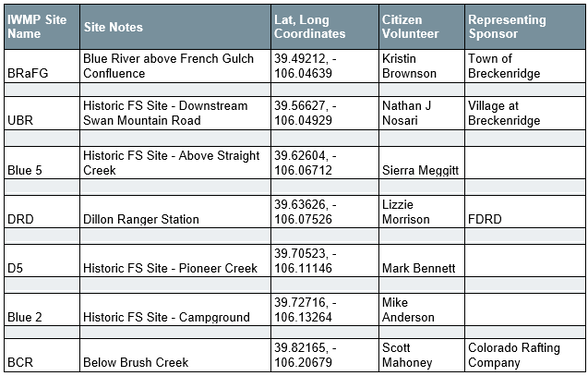
Site Locations |
Volunteer Resources
Logger User Guide
| Adopt a logger instructions 11.20.23 | |
| File Size: | 424 kb |
| File Type: | |
Volunteer Waiver -
REQUIRED sign and return for each person
REQUIRED sign and return for each person
| Volunteer Liability Waiver | |
| File Size: | 128 kb |
| File Type: | |
